The project environment
Resistics uses a project structure for processing magnetotelluric data. There are two things required to create a new project:
A path for the new project
A reference time for the new project
Note
The reference time should be a time before any time data was recorded and gives a reference point for time windowing the entire project.
Below is an example of setting up a new project in the folder tutorialProject. The newProject() method create new folders as required and returns a ProjectData object which holds the project information.
1 2 3 4 5 6 7 8 | from datapaths import projectPath, imagePath
from resistics.project.io import newProject
# define reference time for project
referenceTime = "2012-02-10 00:00:00"
# create a new project and print infomation
projData = newProject(projectPath, referenceTime)
projData.printInfo()
|
Project information can be viewed by calling the printInfo() method or by simply print(projData).
12:34:03 ProjectData: Time data path = tutorialProject\timeData
12:34:03 ProjectData: Spectra data path = tutorialProject\specData
12:34:03 ProjectData: Statistics data path = tutorialProject\statData
12:34:03 ProjectData: Mask data path = tutorialProject\maskData
12:34:03 ProjectData: TransFunc data path = tutorialProject\transFuncData
12:34:03 ProjectData: Calibration data path = tutorialProject\calData
12:34:03 ProjectData: Images data path = tutorialProject\images
12:34:03 ProjectData: Reference time = 2012-02-10 00:00:00
12:34:03 ProjectData: Project start time = 2019-03-03 12:34:03.709213
12:34:03 ProjectData: Project stop time = 2019-03-03 12:34:03.709213
12:34:03 ProjectData: Project found 0 sites:
12:34:03 ProjectData: Sampling frequencies found in project (Hz):
Within the folder tutorialProject, resistics creates another set of folders as shown below:
tutorialProject
├── calData : directory for storing calibration files
├── timeData : directory where time data should be stored
├── specData : directory where spectra data is saved
├── statData : directory where statistic data is saved
├── maskData : directory where window masking information is saved
├── transFuncData : directory where transfer function files are saved
├── images : directory where images are saved
└── mtProj.prj : the project file which allows reloading of a project
The mtProj.prj project file stores some information about the project allowing it to be reloaded easily. It is a text file and can be opened in a text editor such as notepad or notepad++. For this tutorialProject, the mtProj.prj file looks like:
1 2 3 4 5 6 7 8 | Calibration data path = E:\magnetotellurics\code\resisticsdata\tutorial\tutorialProject\calData
Time data path = E:\magnetotellurics\code\resisticsdata\tutorial\tutorialProject\timeData
Spectra data path = E:\magnetotellurics\code\resisticsdata\tutorial\tutorialProject\specData
Statistics data path = E:\magnetotellurics\code\resisticsdata\tutorial\tutorialProject\statData
Mask data path = E:\magnetotellurics\code\resisticsdata\tutorial\tutorialProject\maskData
TransFunc data path = E:\magnetotellurics\code\resisticsdata\tutorial\tutorialProject\transFuncData
Image data path = E:\magnetotellurics\code\resisticsdata\tutorial\tutorialProject\images
Reference time = 2012-02-10 00:00:00
|
The next step is to create a directory for a new site. This can be done using the createSite() method of ProjectData. However, printing the project information again still shows zero sites. This is because only folders with timeseries data in them are counted as sites.
9 10 11 | # create a new site
projData.createSite("site1")
projData.printInfo()
|
Creating a new site only involves creating a new directory. This can also be done manually in the timeData folder.
tutorialProject
├── calData
├── timeData
│ └── site1
├── specData
├── statData
├── maskData
├── transFuncData
├── images
└── mtProj.prj
Once a project has been created, timeseries data should be added to the timeData directory under a site directory.
tutorialProject
├── calData
├── timeData
│ └── site1
| |── dataFolder1
│ |── dataFolder2
| |── .
| |── .
| |── .
| └── dataFolderN
├── specData
├── statData
├── maskData
├── transFuncData
├── images
└── mtProj.prj
Important
Time data folders should start with one of the following:
meas
run
phnx
Once a project has been created and a site populated with data folders, the project can be loaded. It will automatically pick up the new files. Please see the conventions section is your data is not being picked up
1 2 3 4 5 6 | from datapaths import projectPath, imagePath
from resistics.project.io import loadProject
# load the project and print infomation
projData = loadProject(projectPath)
projData.printInfo()
|
Printing the project information now that there is a site with data shows the number of sites found and their start and end dates.
13:01:50 ProjectData: Time data path = tutorialProject\timeData
13:01:50 ProjectData: Spectra data path = tutorialProject\specData
13:01:50 ProjectData: Statistics data path = tutorialProject\statData
13:01:50 ProjectData: Mask data path = tutorialProject\maskData
13:01:50 ProjectData: TransFunc data path = tutorialProject\transFuncData
13:01:50 ProjectData: Calibration data path = tutorialProject\calData
13:01:50 ProjectData: Images data path = tutorialProject\images
13:01:50 ProjectData: Reference time = 2012-02-10 00:00:00
13:01:50 ProjectData: Project start time = 2012-02-10 11:05:00.000000
13:01:50 ProjectData: Project stop time = 2012-02-11 23:03:43.992188
13:01:50 ProjectData: Project found 1 sites:
13:01:50 ProjectData: site1 start: 2012-02-10 11:05:00 end: 2012-02-11 23:03:43.992188
13:01:50 ProjectData: Sampling frequencies found in project (Hz): 128.0, 4096.0
Another useful function is to view the project timeline. This can be done with the view() method of ProjectData. The view() method returns a matplotlib figure object, which can then be saved in the usual way for matplotlib figures.
8 9 10 | # view the project timeline
fig = projData.view()
fig.savefig(imagePath / "loadProj_projectTimeline")
|
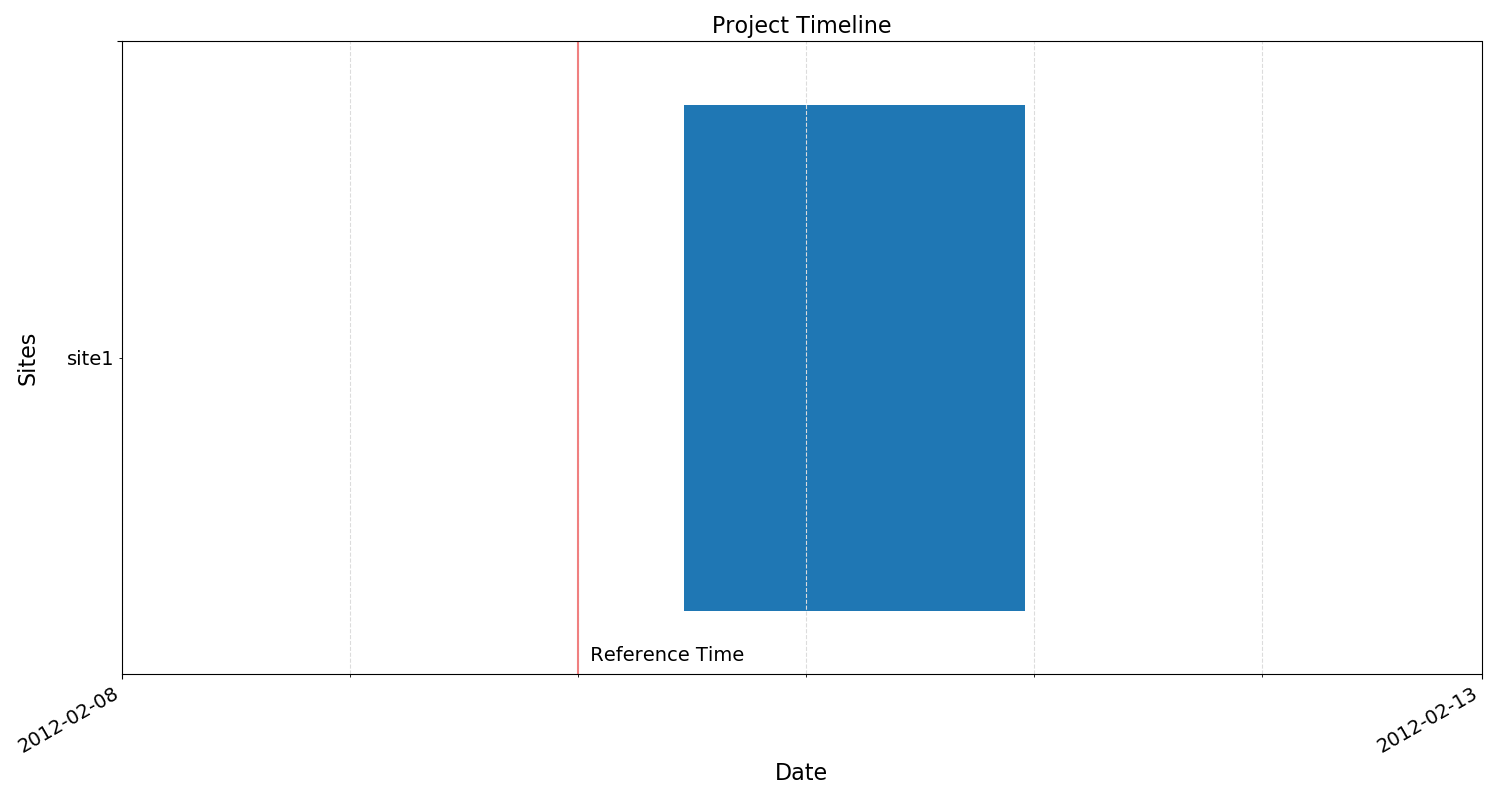
The tutorialProject timeline
Site information can be accessed by using the getSiteData() method of ProjectData. This returns a SiteData object, which holds information about sites. Site information can be printed to the terminal in the same way as project information.
12 13 14 | # get site data
siteData = projData.getSiteData("site1")
siteData.printInfo()
|
13:51:26 SiteData: Site = site1
13:51:26 SiteData: Time data path = tutorialProject\timeData\site1
13:51:26 SiteData: Spectra data path = tutorialProject\specData\site1
13:51:26 SiteData: Statistics data path = tutorialProject\statData\site1
13:51:26 SiteData: TransFunc data path = tutorialProject\transFuncData\site1
13:51:26 SiteData: Site start time = 2012-02-10 11:05:00
13:51:26 SiteData: Site stop time = 2012-02-11 23:03:43.992188
13:51:26 SiteData: Sampling frequencies recorded = 128.00000000, 4096.00000000
13:51:26 SiteData: Number of measurement files = 2
13:51:26 SiteData: Measurement Sample Frequency (Hz) Start Time End Time
13:51:26 SiteData: meas_2012-02-10_11-05-00 4096.0 2012-02-10 11:05:00 2012-02-10 11:24:59.999756
13:51:26 SiteData: meas_2012-02-10_11-30-00 128.0 2012-02-10 11:30:00 2012-02-11 23:03:43.992188
Site timelines can also be viewed using the view() method of SiteData, which again returns a matplotlib figure object allowing the plot to be easily saved.
15 16 | fig = siteData.view()
fig.savefig(imagePath / "loadProj_siteTimeline")
|
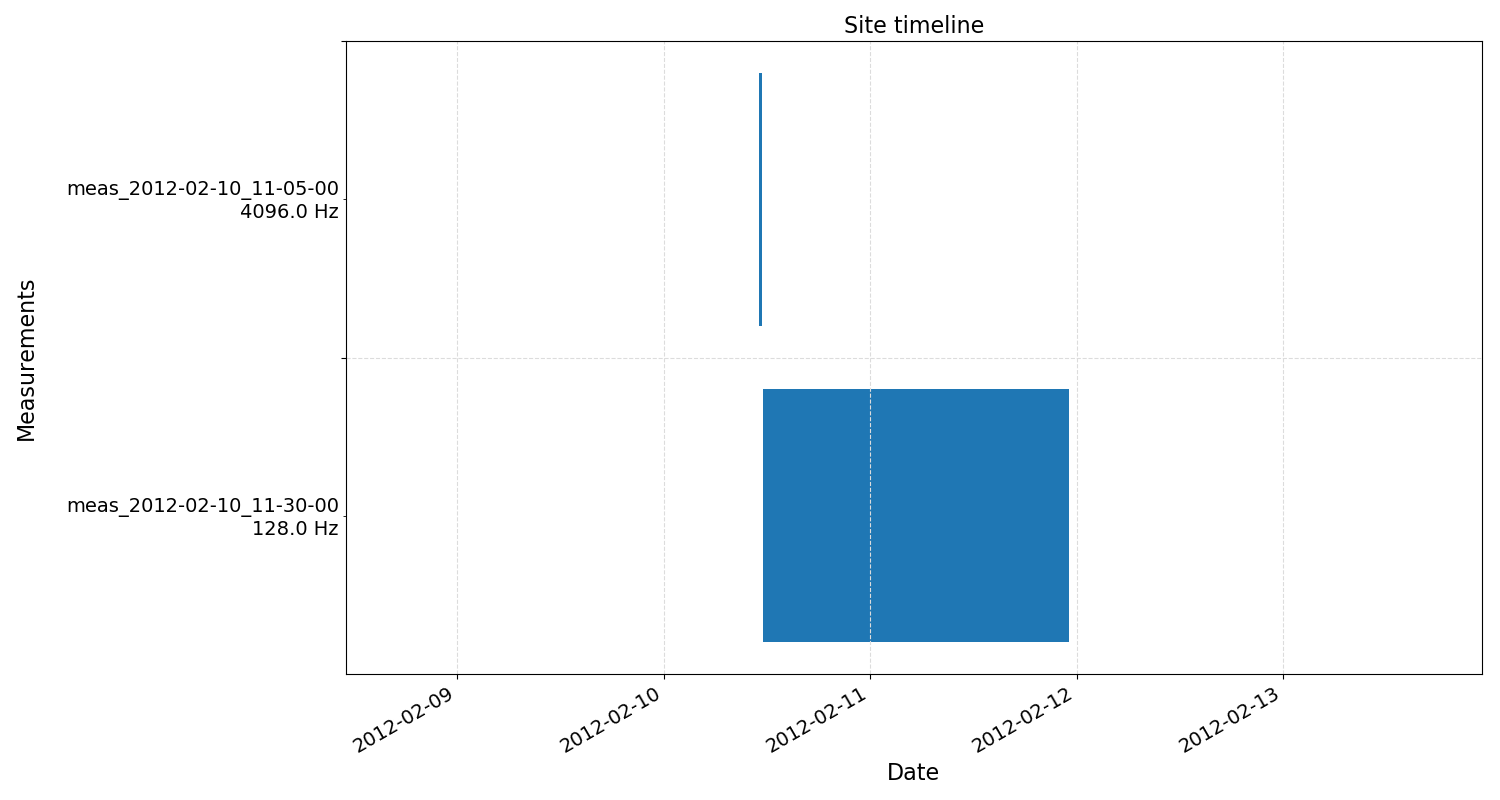
The site timeline
Complete example scripts
For clarity, the complete example scripts are provided here.
The create project script:
1 2 3 4 5 6 7 8 9 10 11 | from datapaths import projectPath, imagePath
from resistics.project.io import newProject
# define reference time for project
referenceTime = "2012-02-10 00:00:00"
# create a new project and print infomation
projData = newProject(projectPath, referenceTime)
projData.printInfo()
# create a new site
projData.createSite("site1")
projData.printInfo()
|
The load project script:
1 2 3 4 5 6 7 8 9 10 11 12 13 14 15 16 | from datapaths import projectPath, imagePath
from resistics.project.io import loadProject
# load the project and print infomation
projData = loadProject(projectPath)
projData.printInfo()
# view the project timeline
fig = projData.view()
fig.savefig(imagePath / "loadProj_projectTimeline")
# get site data
siteData = projData.getSiteData("site1")
siteData.printInfo()
fig = siteData.view()
fig.savefig(imagePath / "loadProj_siteTimeline")
|