Partial coherence
The bivariate coherence between inputs Hx and Hy and output Ex is given by:
When there is a strong linear relationship between the inputs Hx and Hy and output Ex, this ratio is close to 1. However, when there is no such relationship, this ratio is closer to 0.
Simarly, for Ey, the equation is:
The value can be interpreted in a similar way.
In general, good magnetotelluric data follows a strong linear relationship such that bivarx and bivary should both be close to 1.
Partial coherences measure the linear relationship between two signals after the influence of a third signal has been removed. For example, to find the partial coherence Ex Hy, the inluence of Hx needs to be removed. This is done as follows:
Where coherencexx is the standard coherence between Ex and Hx.
Here, the influence of Hx on the linear relationship between Ex and Hy is being removed. However, in most situations, the coherence between Ex and Hx is small due to induction of perpendicular currents. Therefore, partial coherences for magnetotellurics tend to give similar results to bivariate coherence and even standard coherence.
Important
The resistics name for the parital coherence statistic is: partialCoherence.
The components of the partial coherence statistic are:
bivar Ex
bivar Ey
par Ex Hx
par Ex Hy
par Ey Hx
par Ey Hy
An example of bivariate and partial coherence statistics are shown below. The values plotted here suggest a noisy measurement.
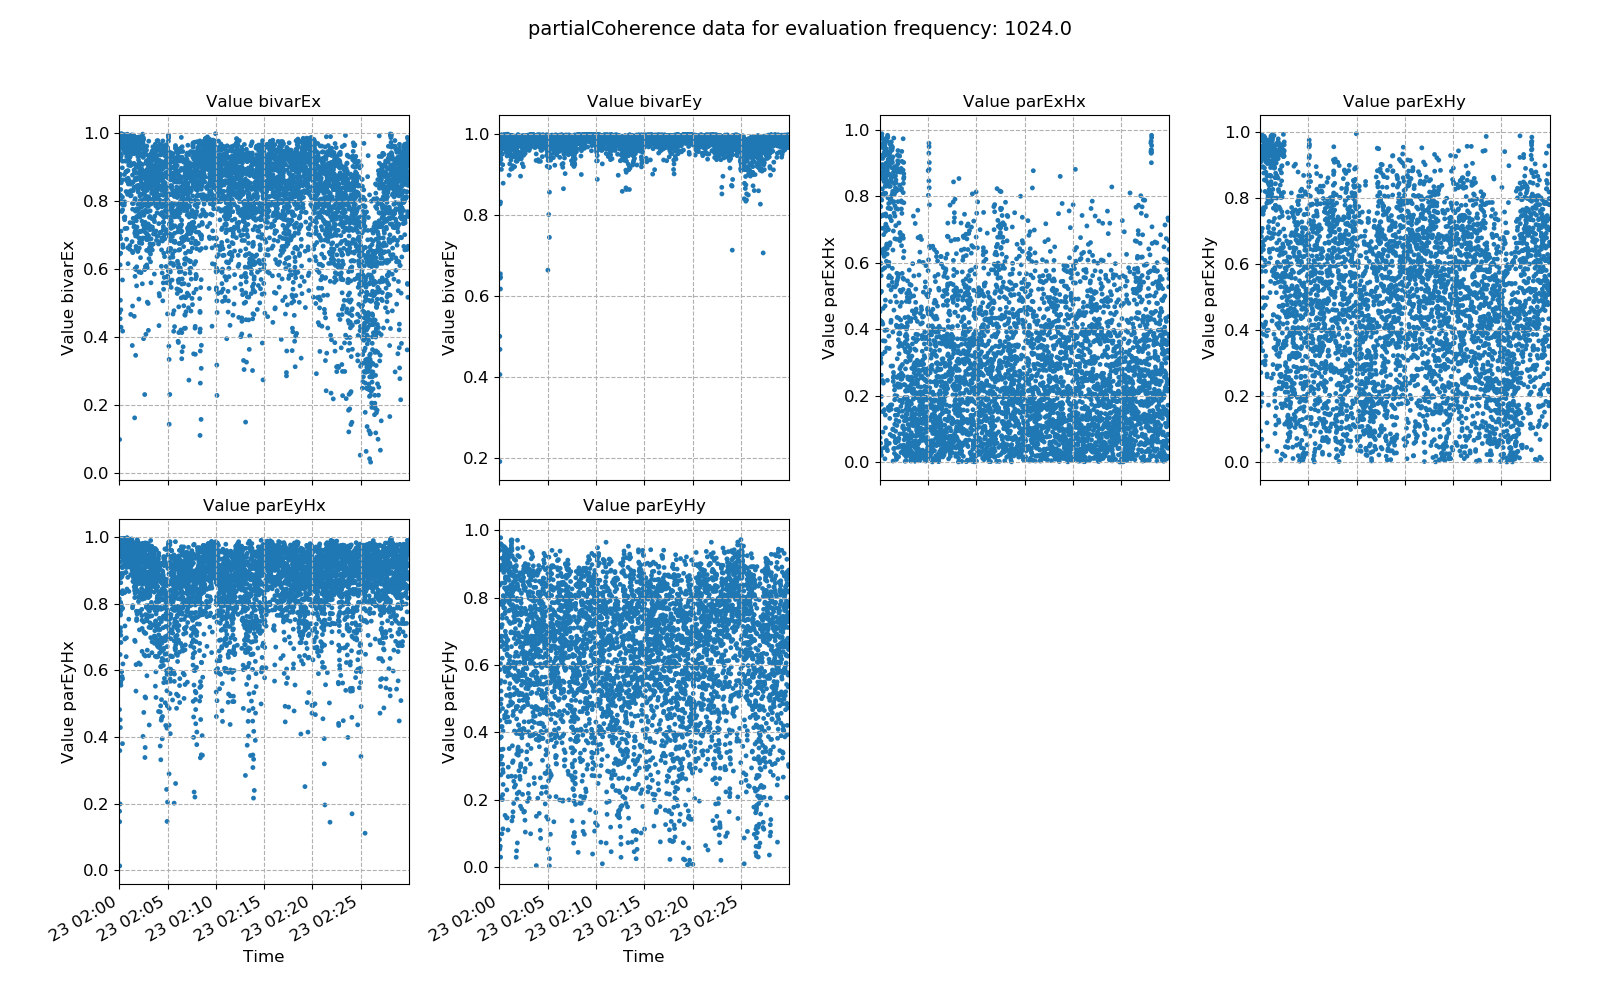
Bivariate and parital coherences plotted over time for evaluation frequency 1024 Hz
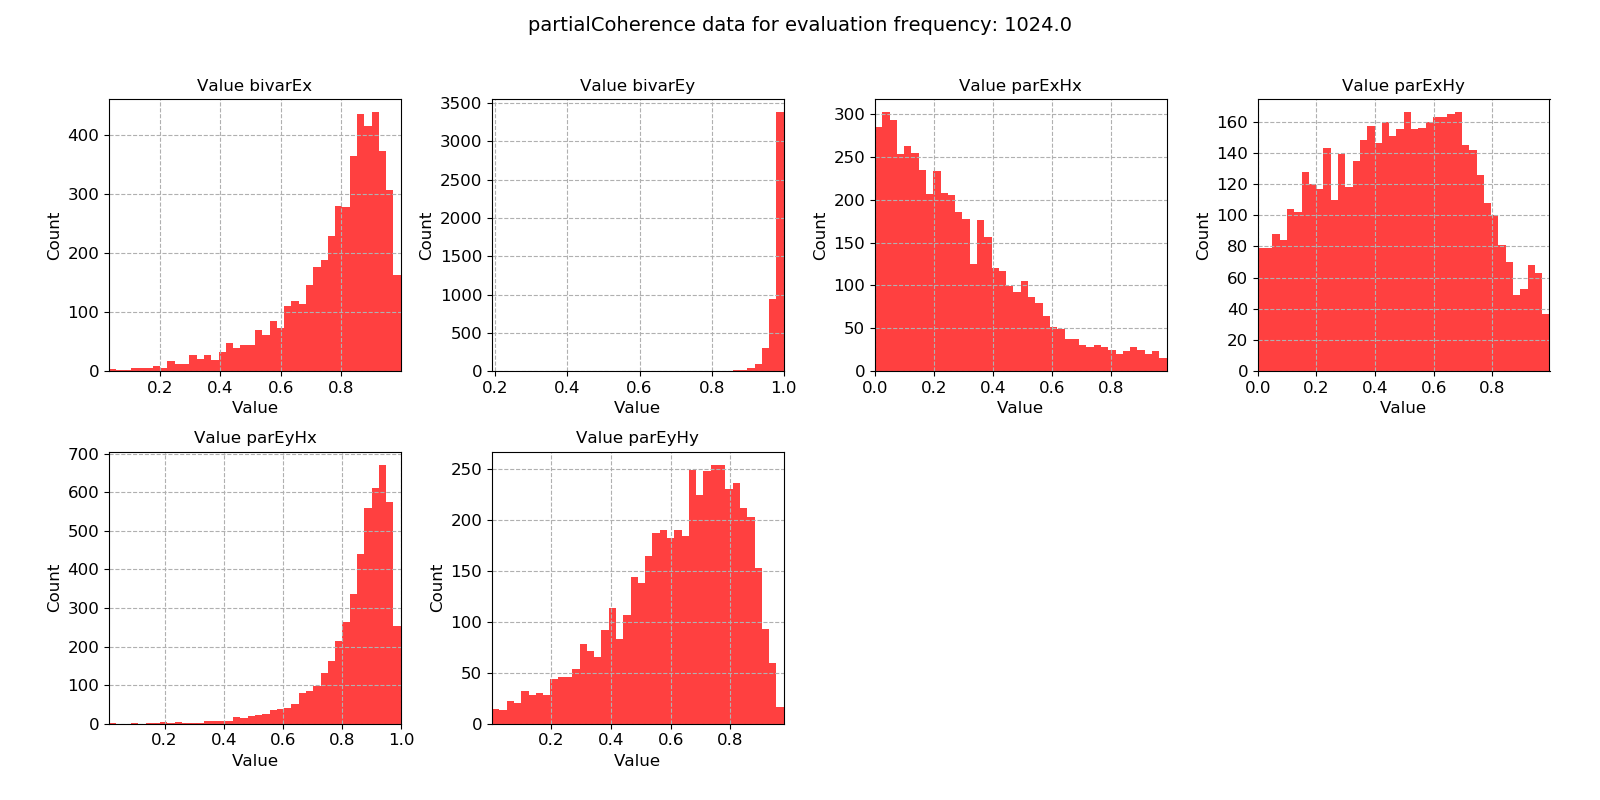
Bivariate and partial coherence histograms for evaluation frequency 1024 Hz
The same plots are shown below for another measurement sampled at 128 Hz. Here, the bivariate and partial coherences suggest good data quality in the evenings, after 16:00. However, even after this time, there is still scatter that could be removed using masks.
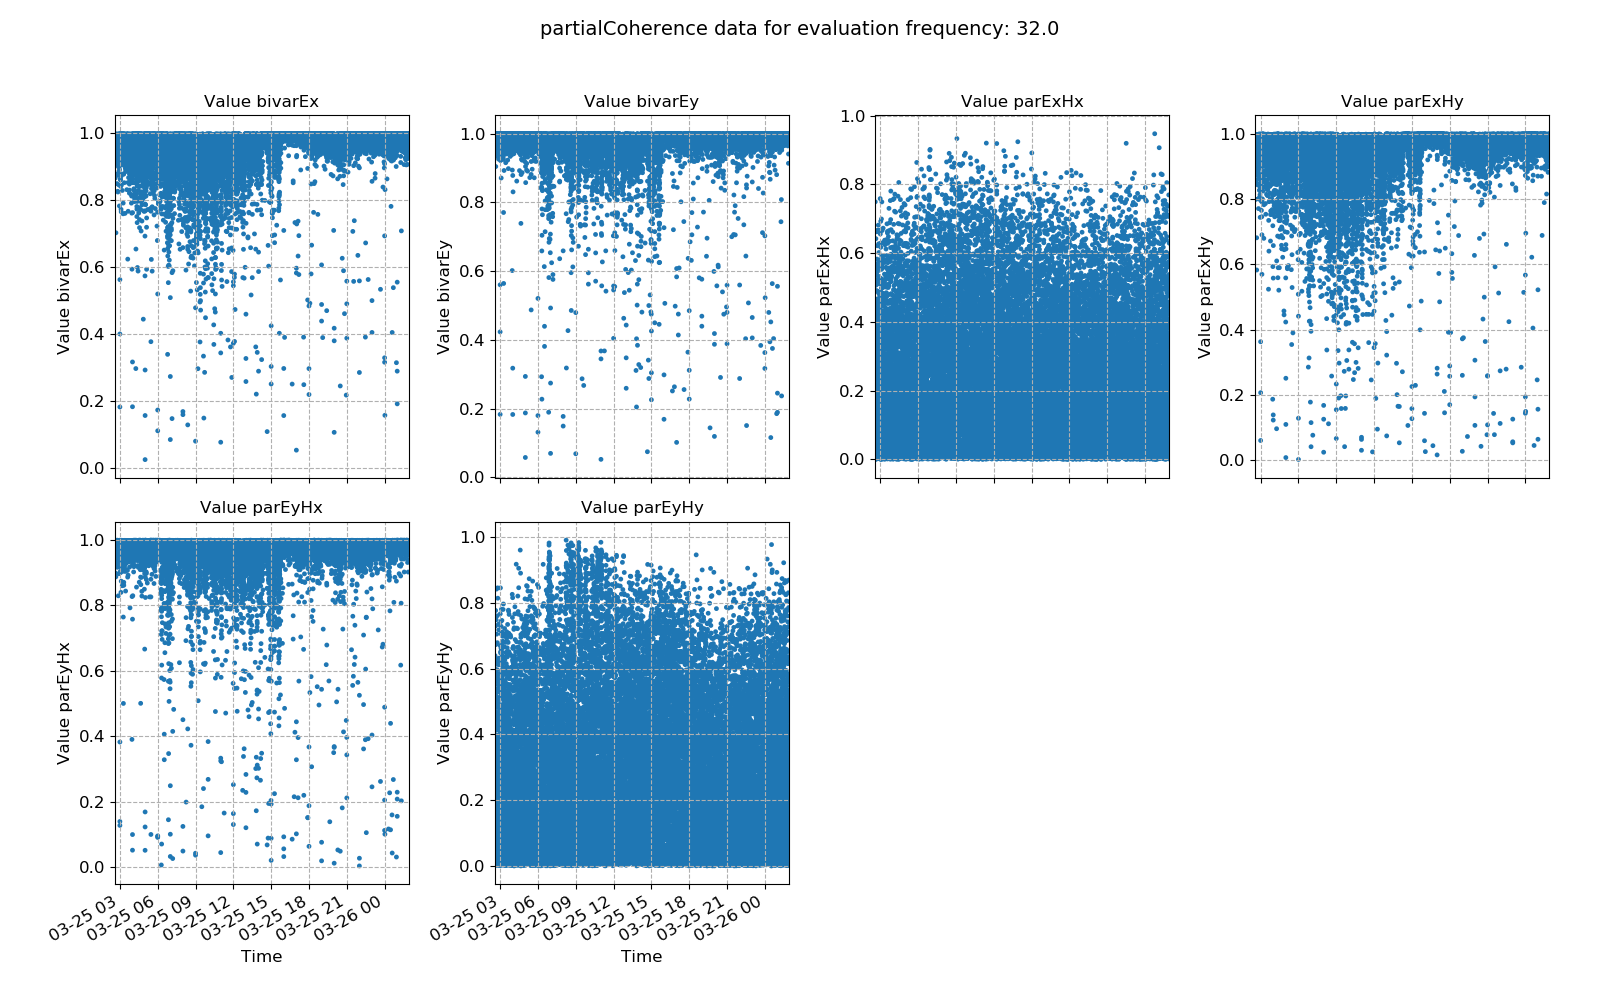
Bivariate and parital coherences plotted over time for evaluation frequency 32 Hz
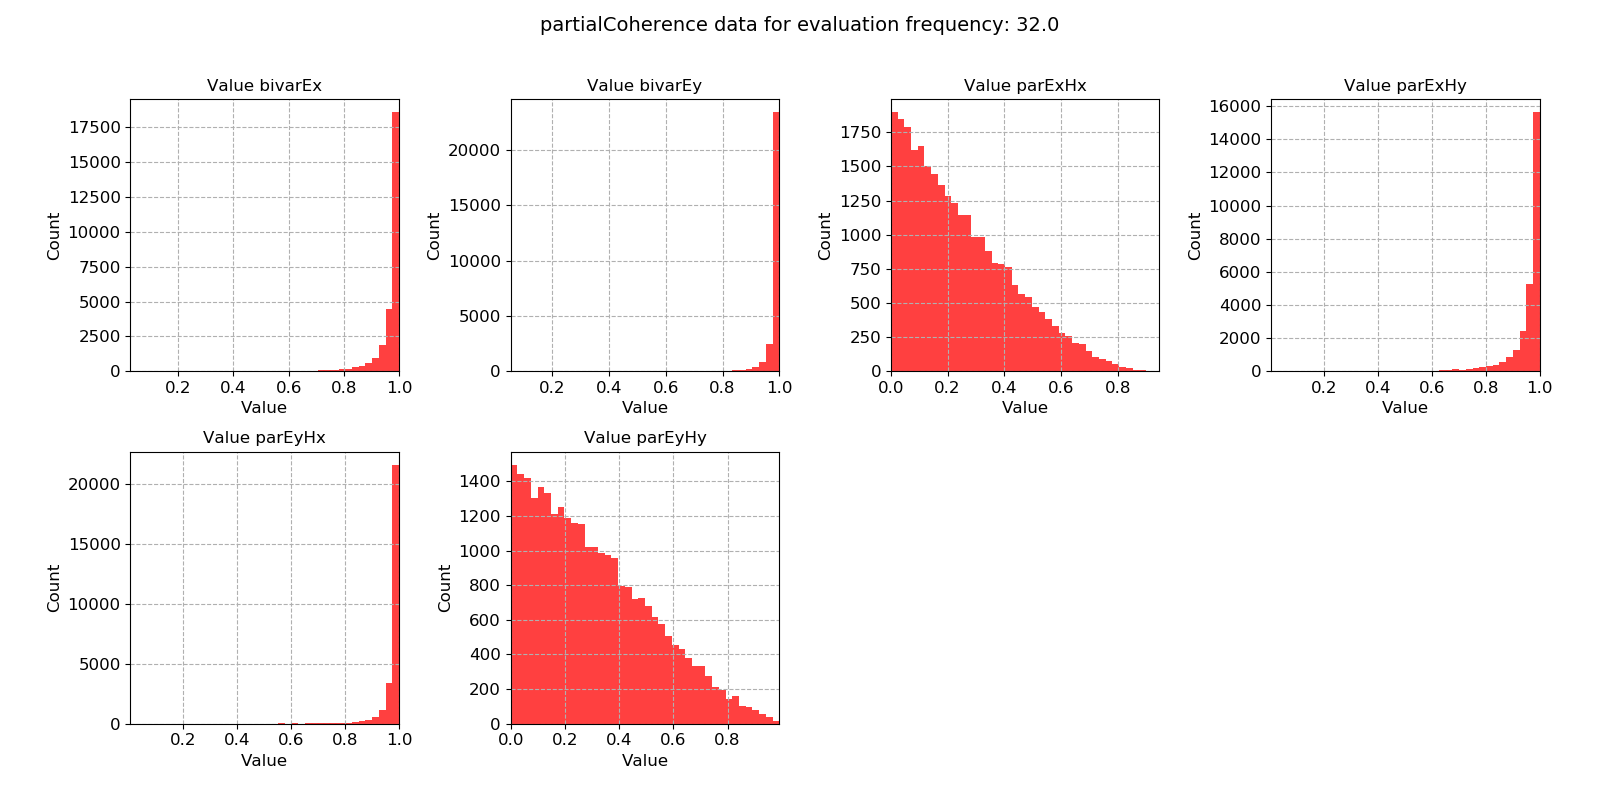
Bivariate and partial coherence histograms for evaluation frequency 32 Hz