Coherence
Coherence measures the relationship between signals. For a linear system, it can be used to estimate the power transfer between the inputs and outputs. The coherence of two signals is a value between 0 and 1, where 0 suggests no power transfer and 1 represents full power transfer.
For more detailed information about coherence, see: Wikipedia.
Important
The resistics name for the coherence statistic is: coherence.
The following components are calculated out:
coh Ex Hx
coh Ex Hy
coh Ey Hx
coh Ey Hy
In most cases, the off-diagonals are expected to be small as Ex is not expected to significantly impact Hx and similarly with Ey and Hy. Generally, the coherences of interest are between Ey-Hx and Ex-Hy. High values of coherence between Ex-Hy and/or Ey-Hx often represent good data and time windows with such high values are normally kept for transfer function estimation. However, high coherence values can also be caused by a nearby coherent source of electromagnetic energy.
An example of window-by-window coherence values is shown below.
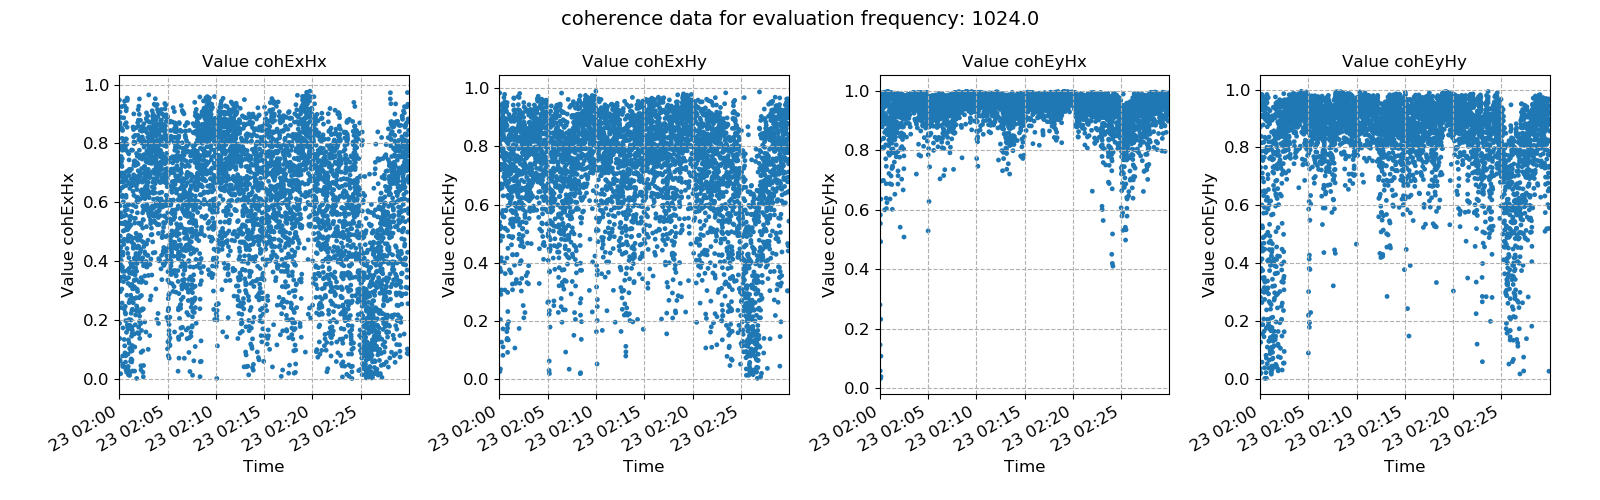
An example of coherence pairs plotted over time
The above coherence shows a couple of trends:
Generally, Ey-Hx is more coherent than Ex-Hy
Near the end of the recording something caused the coherence to fall primarily in Ex coherences. Studying the Ex timeseries might provide more clues to the cause of this.
Another way to look at the same data is in the form of a histogram. Ideally, there should be more higher coherent values than lower ones.
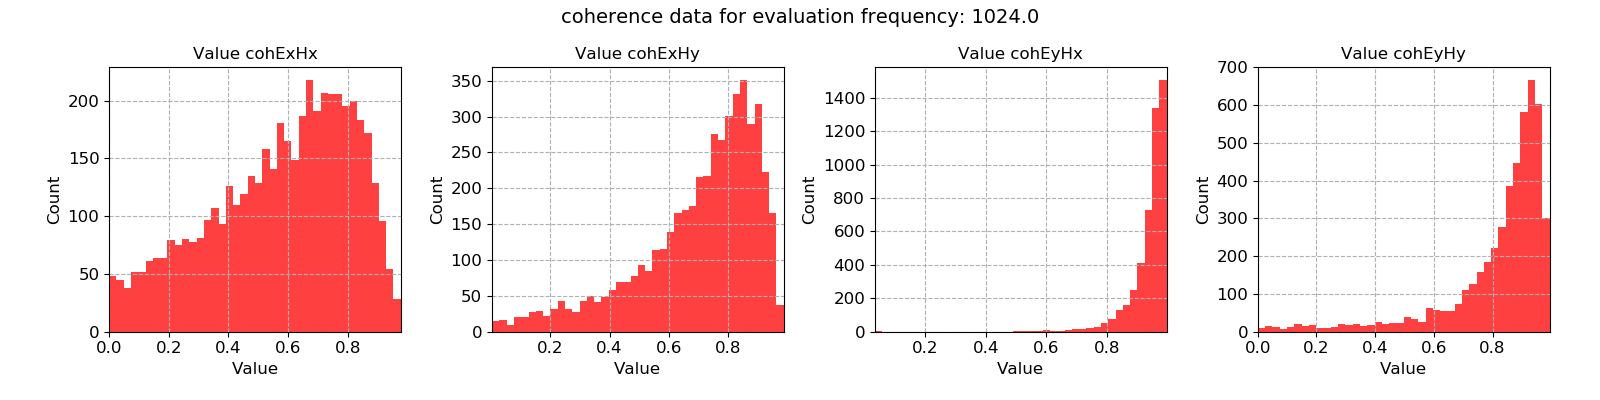
A histogram of coherence values for the various coherence pairs
Below are two additional plots from a different day long recording at 128 Hz. In this case, the coherence plots show a significant improvement after 16:00. Before this time, there are significant numbers of noisy windows. The noise is probably cultural and due to daily human activity.
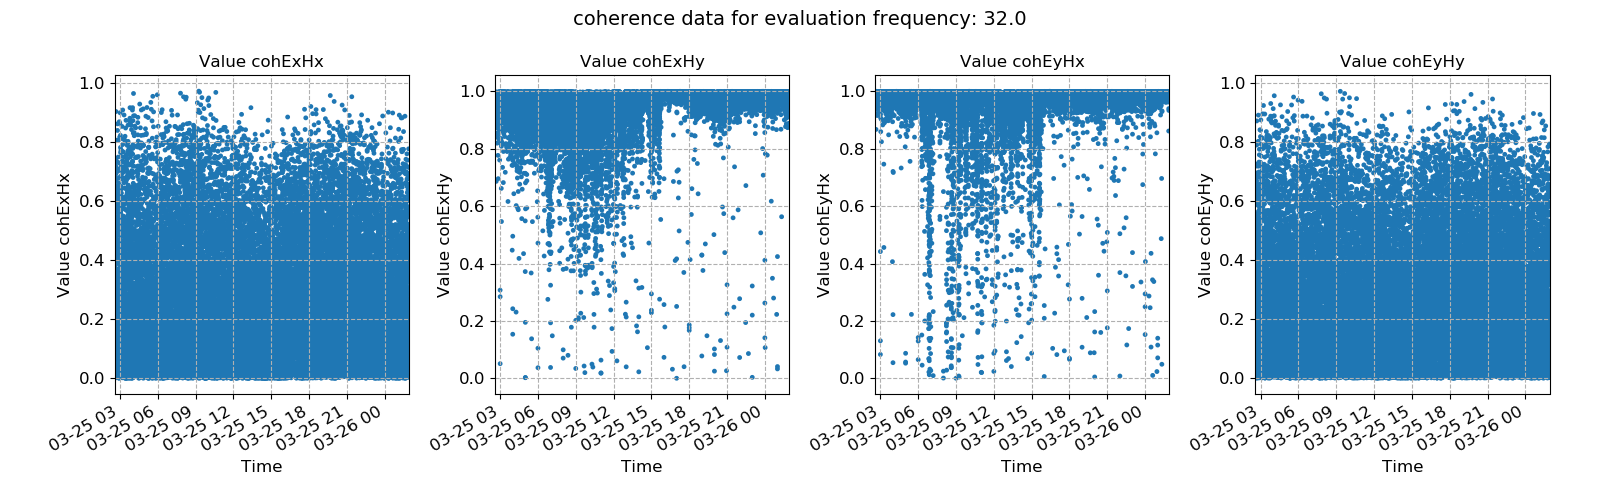
Window-by-window coherence values against time
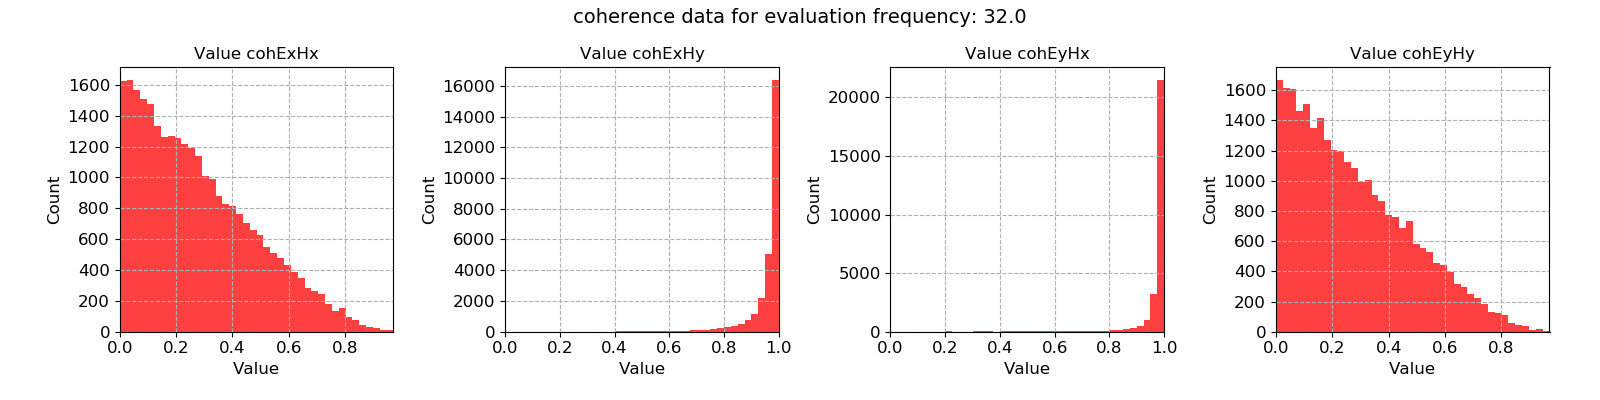
Window-by-window coherence values plotted in a histogram